
You can observe a lot by watching. — Yogi Berra
The exact origins of baseball are debatable. What’s less debatable, is no matter when the game was first played, statistics have and will always be a part of the game. With evolving technology and data analytic systems, it seems every aspect of baseball is now recorded, counted, and compared analytically. Although teams, scouts, and fans enjoy the ability to evaluate player performance with this data, it can be better put to use in injury research.
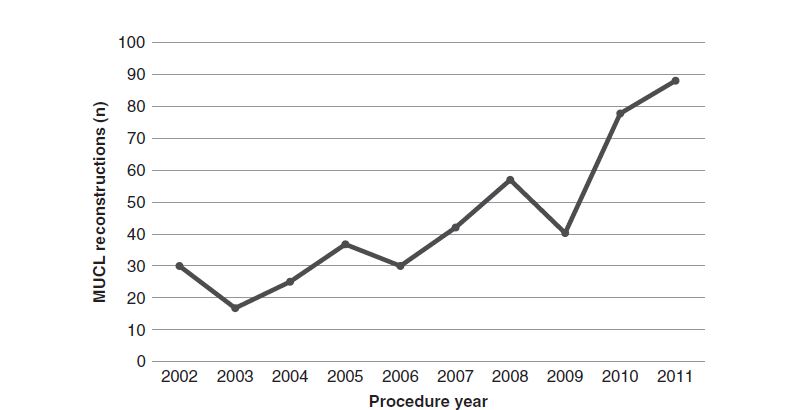
Baseball is one of the most popular sports played by among high school-aged boys, with nearly 500,000 athletes hitting the field annually. Unfortunately this demographic is highly at risk for elbow UCL injury, a fact we emphasized in published data confirming the seriousness of the elbow UCL injury epidemic in the United States. Figure 1 shows how the number of elbow UCL reconstructions is on the rise, and underlines a more concerning issue—that boys aged 18 and younger are now the most likely to undergo surgery.
Many, if not most, high school baseball players, have aspirations of playing in college. Of the nearly 500,000 high school baseball players, approximately 25,000 eventually go on to play collegiate baseball each year. Many collegiate baseball injuries occur in the practice setting or during the preseason. This emphasizes the critical importance of adequate off-season conditioning and preseason training to prevent overuse injuries in collegiate student athletes.
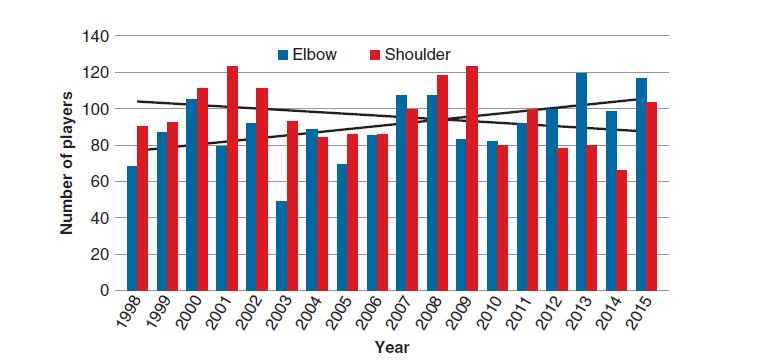
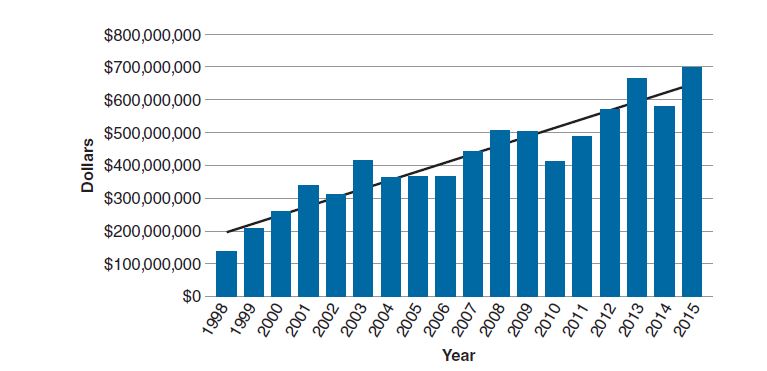
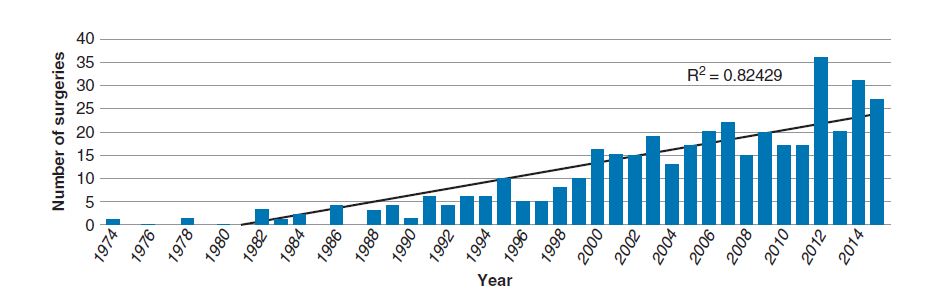
In professional baseball, we’ve observed a fascinating trend in shoulder and elbow injuries. While the overall percentage of injuries occurring to the upper extremity remained the same over time, the rate of shoulder injuries has steadily decreased while the rate of elbow injuries has increased. This is shown in Figure 2. The cost burden of these injuries, has been calculated to be an average of over $423 million paid out by teams annually because of players on the DL and the added cost of replacement players (Figure 3). Figure 4 shows the general trend of rising UCL reconstructions in major league baseball. It’s the goal of our ongoing research to change this, and more importantly, change the growing number of surgeries in our youth athletes, nationwide.